.svg)


How Kwant's WorkforceOS turns the largest construction safety dataset in the industry into proactive risk action.
By John Kalajian and Niran Shrestha
Every Safety Week, the construction industry recommits to the same goal: send every worker home safely. But the way we get there is changing. For decades, safety has been a retrospective discipline, counting incidents after they happen, reviewing toolbox talks after the shift, auditing compliance after the inspection. The leading indicators were defined long ago: TBTs, planned trainings, manual audits, and supervision. What's been missing is a way to see them moving together, in real time, before an incident shows up in the lagging numbers.
That's what predictive safety intelligence is supposed to deliver, and it's where most of the industry is about to hit a wall, because the conversation has gotten stuck on LLMs, when the real unlock is something else entirely.
The Industry's Real Bottleneck Isn't AI. It's Data.
All the headlines paint the same picture: construction is in the middle of a workforce shortage. At the same time, projects are getting more complex, schedules are tighter, and compliance requirements are heavier. More work, fewer skilled workers, higher standards. Safety documentation is finally digitizing, TBTs, HRAs, audits, incident reports, observations, but most of that data sits fragmented across systems, written in inconsistent free text, and reviewed only after the fact.
The construction safety AI platform that actually solves this problem has to do more than read the data. It has to learn from it, at scale, over time, across projects and trades and environments that no single company's dataset can cover alone.
Plenty of vendors will tell you they've solved this with an LLM. They haven't. And it's worth being precise about why.
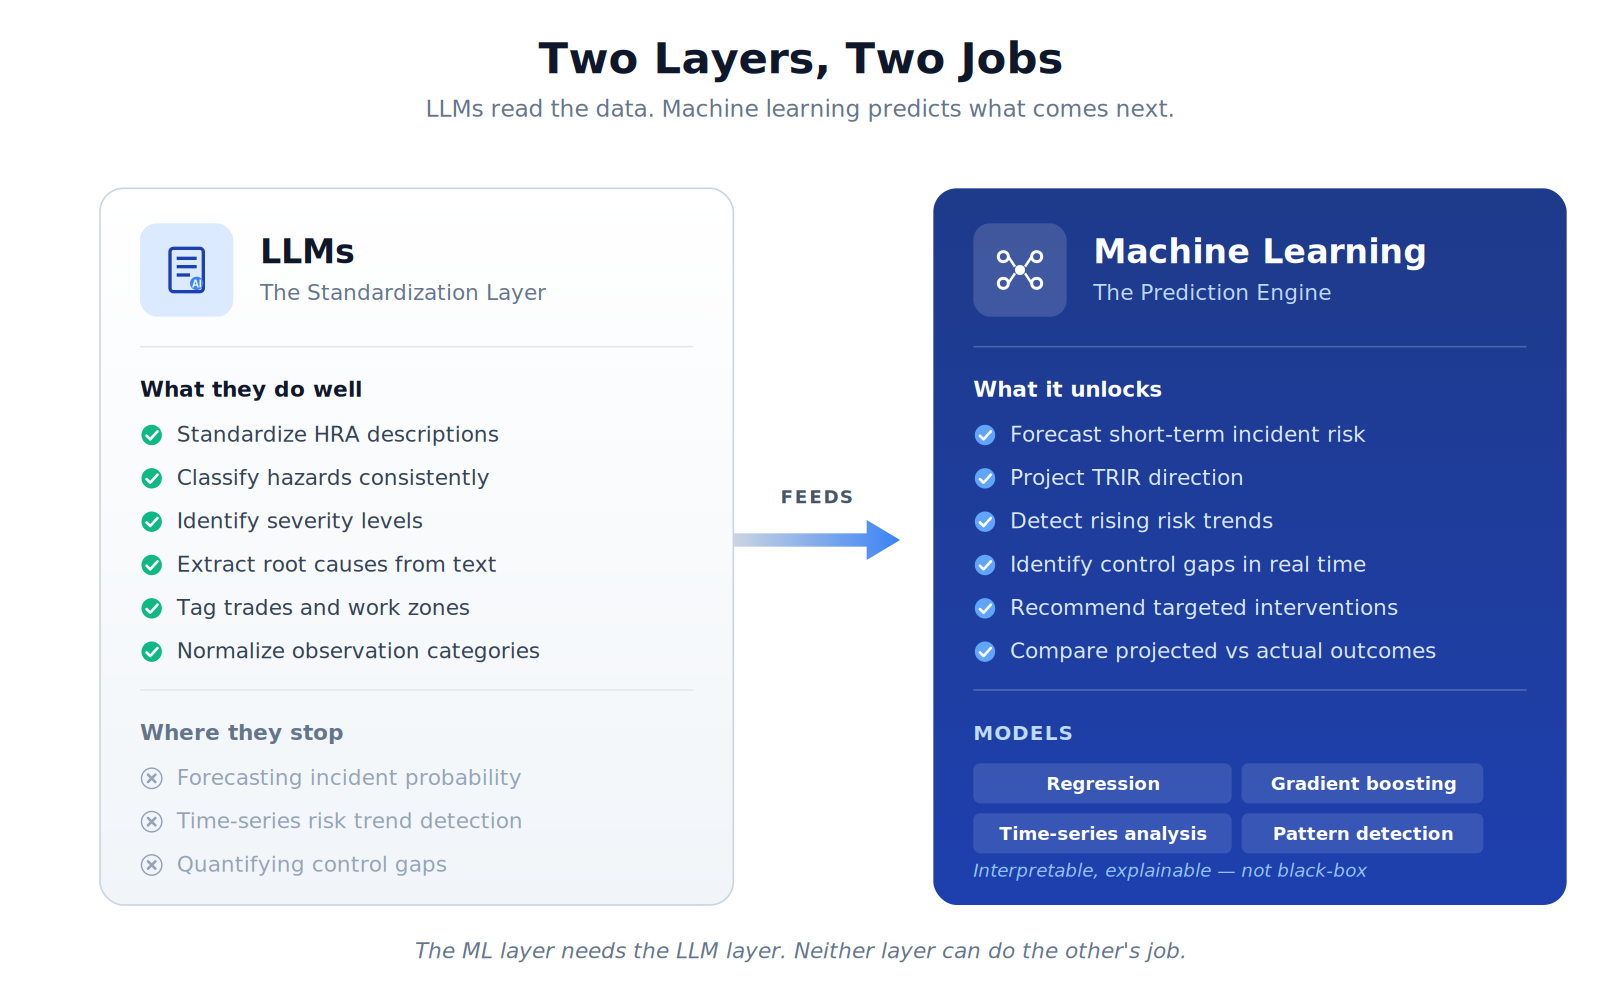
What LLMs Actually Do Well, And Where They Stop
Large Language Models are genuinely transformative for one specific job in safety: turning messy, unstructured documentation into structured, comparable data.
At Kwant, we use LLMs to:
- Standardize HRA descriptions across thousands of subcontractors who all write them differently
- Classify hazards consistently so a "fall risk" on one project means the same thing on another
- Extract severity levels and root causes from narrative incident reports
- Tag trades and work zones automatically
- Normalize observation categories across audits, inspections, and field reports
That's enormously valuable. It's the layer that makes everything downstream possible. But it's also where the LLM's job ends.
LLMs forecast based on static inputs. They don't quantify real-time risk. They don't tell you that worker-hours in Zone 3 have climbed 40% this week while toolbox talk frequency stayed flat, and that this combination has historically preceded a 2.1x increase in recordable incidents over the next ten days. That's not a language problem. That's a pattern recognition problem across millions of data points, time-series signals, and exposure-adjusted baselines. That's the domain of machine learning and predictive analytics, and it requires something LLMs can't substitute for: massive volumes of longitudinal, real-world workforce data.
.png)
Why Kwant Has the Data Other Platforms Don't
This is the part of the conversation that gets glossed over. Predictive models are only as good as the dataset they're trained on, and in construction safety, the dataset is the moat.
Through WorkforceOS, Kwant has captured millions of work hours across more than 250,000 workers, along with thousands of safety alerts and records spanning thousands of GCs and subcontractors. Kwant WorkforceOS has supported construction contractors across mission-critical data center campuses, LNG facilities, airport construction programs, large-scale multifamily developments, and manufacturing builds. That's not a pilot dataset or a single-customer feed, it's a cross-project, cross-trade, longitudinal foundation that links workforce behavior, compliance status, scheduling, and safety outcomes at scale. No one else in the industry has assembled this combination.
Not only does the Kwant platform contain historical workforce data, it also shows you real-time data as well. A resource that is severely undervalued in construction. Consider the stock market – companies that can gain even a fraction of a second advantage over their competitors reign supreme. The ability to view real-time data is paramount in predictive markets.
Just as importantly, Kwant doesn't operate as an island. Kwant supports native integration with existing tools. Native integrations with Procore, HammerTech, CMiC, and Primavera P6 mean production data, schedule data, and safety data flow into a single intelligence layer. Add OSHA public records, insurance benchmarks, weather and environmental data, access control logs, and camera-based observations on top of that, and you have something genuinely rare: a unified picture of what work is happening, who's doing it, under what conditions, with what controls in place, and what happened next.

That last part, what happened next, is what makes prediction possible. Without years of outcome data tied to the conditions that preceded them, a model has nothing to learn from. With it, you can start identifying when current conditions resemble historical pre-incident patterns, before the lagging indicators move. Now consider the importance of accessing a real-time snapshot of the jobsite to coincide with the insights or forecasts generated by LLMs. Astronomers have been looking up at the night sky for centuries to study the universe, however everything they see resides in the past due to the time it takes light to reach us. If we were able to cross-reference what we’ve learned about the universe with the real-time positions of everything in it, it would instantaneously pave the way to a tsunami of discoveries and predictions
From Monitoring to Forecasting: How the Model Actually Works
The Kwant Predictive Safety Intelligence platform continuously evaluates two things in parallel.
On one side, work intensity and exposure: worker-hours by trade and zone, overlapping high-risk activities, fatigue accumulation patterns, congestion and workforce density, environmental stress conditions, and work sequencing complexity. These get rolled into a dynamic risk score across crews, zones, trades, and projects.
.png)
On the other side, safety control strength: certifications and compliance currency, HRA frequency relative to high-risk activity levels, toolbox talks aligned to active hazards, supervisor-to-worker ratios, training validity for the tasks actually being performed, and inspection cadence.
When work intensity climbs but safety controls don't scale proportionally, that's a control gap, and historically, control gaps are where incidents come from. Combining the two sides produces projected incident rate trends, including expected Total Recordable Incident Rate (TRIR) direction within short-term windows.
Beyond the guesswork of traditional forecasting, these early warning signals provide actionable intelligence for immediate intervention.. When an upward trend is detected, the system surfaces concrete recommendations: increase HRA reviews, deploy targeted refresher training, increase the frequency of safety walks and inspections in the affected zone, adjust overlapping high-risk activities, or assign additional supervision. Then it monitors whether the trend stabilizes, closing the loop between projection, intervention, and outcome.
PPE Includes Tech Too
The data foundation isn't standing still. The next layer of inputs is already arriving on the worker. Hard hats, vests, glasses, gloves, and boots have always been the visible face of safety, and they're now being joined by smart badges, AI-powered cameras, and site-wide sensor networks that turn protective equipment into a continuous stream of real-time signals.

Smart badges report worker location, fatigue, access events, and falls. AI cameras detect PPE compliance, unsafe behaviors, and zone breaches without a supervisor having to be physically present. Sensor networks pick up air quality, gas exposure, dust, noise, temperature, and vibration across zones. Each of these feeds the same underlying models, meaning the more connected the jobsite gets, the sharper the predictions become. PPE stops being passive protection and becomes an active part of the intelligence loop.
Why Machine Learning Is the Future, Not Just the Buzzword
The analytical engine underneath all of this is deliberately not a black box. Depending on data maturity, it combines exposure-adjusted regression for baseline risk estimation, gradient boosting models that capture nonlinear and compounding risk factors (the way fatigue and overlapping high-risk work interact, for example), and time-series analysis for upward trend detection. LLMs sit alongside as the standardization layer, turning unstructured input into structured signal, but the prediction itself is a machine learning problem.
The emphasis throughout is on interpretable, explainable models. Safety leaders need to know why a risk score is rising, not just that it is. A recommendation to increase supervision in a specific zone is only useful if the underlying reasoning is transparent enough to act on with confidence.
And critically, the model improves over time. Every incident, every intervention, every variation across trades and environments feeds back into the system. The more data flows through, the more accurate and project-specific the recommendations become. This is the compounding advantage of scale and it is why a platform with hundreds of thousands of workers and millions of hours behind it will pull further ahead of platforms that don't, year over year. That compounding advantage is not theoretical. It is already happening.
The Strategic Picture
For safety leaders, the value of this isn't theoretical:
- Leading indicators get strengthened proactively, not retroactively
- Safety resources get prioritized based on measurable risk, not gut feel
- Incident rate volatility goes down because interventions happen earlier in the cycle
- Portfolio-level visibility improves dramatically, you can see which projects, trades, or regions need attention before TRIR moves
- A genuine data-driven foundation for continuous improvement replaces compliance-by-checklist
None of this replaces safety leadership. It enhances it. The judgment, the relationships, the field presence, the safety culture, those remain the heart of the work. What predictive intelligence adds is a forward-looking lens that humans alone can't maintain across thousands of workers, hundreds of zones, and dozens of concurrent projects.
This Safety Week, Let's Raise the Bar
Safety Week is a moment to step back and ask whether the tools we're using are actually helping us send people home safely, or just helping us document the attempt. The honest answer for most of the industry is the latter. We're still managing safety with rear-view mirrors.
Predictive Safety Intelligence changes that. But it only works if the data underneath it is broad enough, deep enough, and connected enough to learn from. LLMs help us read the data. Machine learning helps us act on it. And the organization with the largest, most integrated workforce dataset in construction is the one positioned to make that future real.
That's why Kwant exists, and that's the commitment we're making this Safety Week: to keep turning the industry's safety data into proactive, risk-reducing action, so the next incident is the one that doesn't happen.
See Predictive Safety in Action: Discover how Kwant WorkforceOS turns real-time jobsite data into proactive risk prevention.
.png)
%20(1).svg)


